Here is the Expected Goals timeline graphic for the MK Dons v Charlton League 1 game on 17 Feb 2018, by Ben Mayhew @ Experimental 361
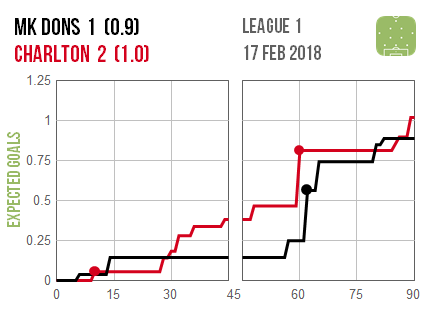
Explanation:
There are two numbers next to each club’s name.
The first number is how many goals each club actually scored, if any.
The second number (in brackets) is the number of goals that an average team would have expected to score from their shots - the "Expected Goals" from all the chances created by that team added together over the course of the match.
The lines on the graphic track how each team's Expected Goals tally, cumulatively increased over the first & second halves of the match.
Every jump upwards in a line, is a shot by that club, with bigger jumps upwards corresponding to more promising chances.
Blobs appear on the Expected Goals line, wherever goals were actually scored by that club during the game, if any.
The Expected Goals timeline graphics can provide a better sense of how each game played out, who deserved to win, who was lucky/unlucky etc. than edited highlights and/or the basic shots, shots on target, and possession stats do.
Full explanations & the other timeline graphics for this round of League 1 fixtures can be found at Experimental 361:
https://experimental361.com/2018/02/18/ ... -feb-2018/
An explanation of Expected Goals (xG) is also available from BBC Sport - well worth a read if you are still unclear on Expected Goals, what they are, and what they can signify:
http://www.bbc.co.uk/sport/football/40699431